19/10/2022
Trend Digital Dashboards: How to keep track of your manufacturing chain in real time
Digitalization means data. The more digital a company becomes, the more data it generates. And the more networked the company is, the more places this data is available. This means that things very quickly become confusing. Data not only has to be available, it also has to be prepared in such a way that the respective viewer can derive optimum benefit from it.
Digital Dashboards: Making data visible
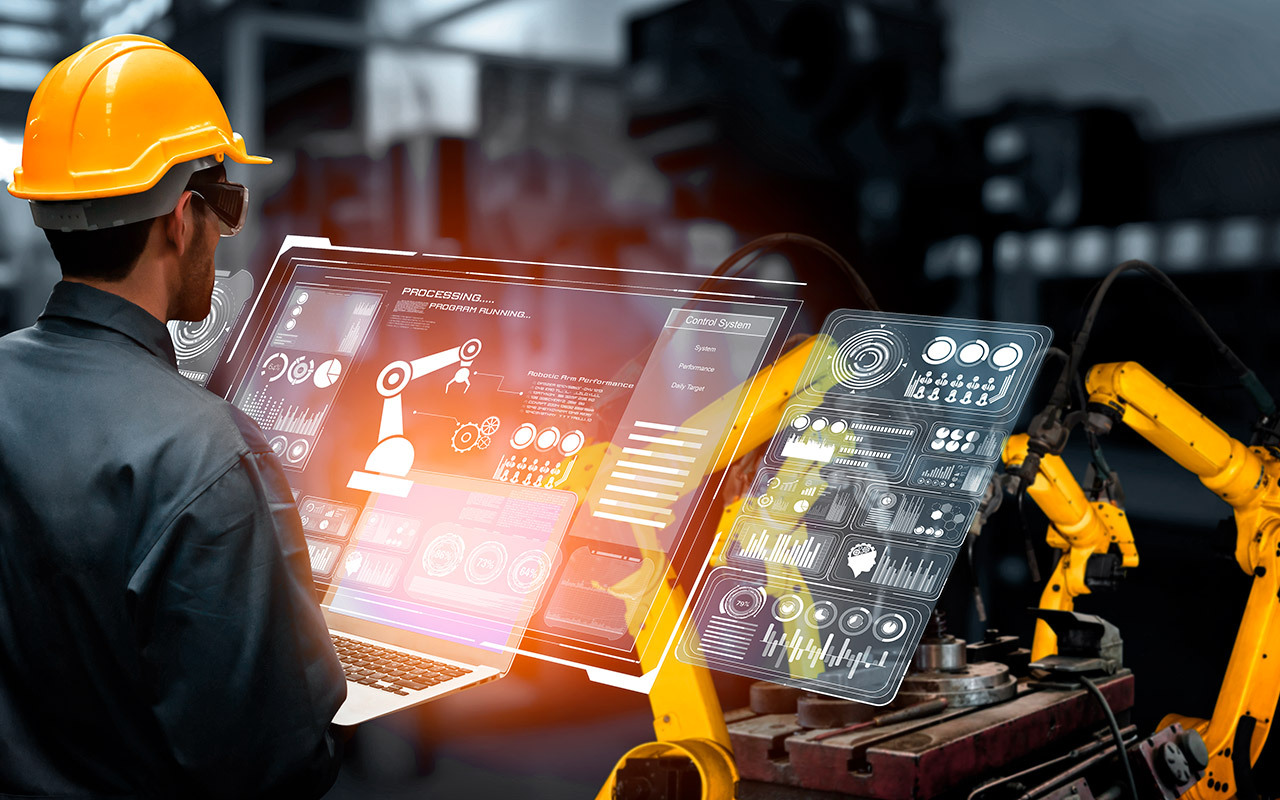
Digital dashboards display relevant data in such a way that the viewer can grasp it quickly and easily - much like the dashboard in a car, to which the English word "dashboard" also refers. Often, this data is relevant for marketing to determine how successful certain measures have been. The digital dashboard is based on sensors that generate and pass on data, as well as other data from the company, for example from order management. NC-controlled machining centers are usually already equipped with such sensors and make it possible – if necessary, after an update or expansion of the control software – to read out data. Other machines can be expanded quite easily with plug&play retrofit modules, such as those offered by oee.ai or 3D Signals.
Pulling the right data together
But collecting data is not enough – if it disappears into a "data grave," nothing has been gained. When setting up structures for digitalization, it is important not only to use the possibilities offered by technology, but also to define goals. So, who should see the collected data and for what purpose? The former question is a matter of security, the latter a question of processing. The machine operator, the service technician and the production manager are each interested in the machine's data – but each of them needs a different view of the data: The machine operator primarily needs order data to see how far an order has been processed and which next orders are waiting, as well as real-time data from the machine: speeds, temperatures and other status data. The service technician, on the other hand, is interested in the "health data" of the machine and its progress: Temperatures, vibrations and similar sensor data over specific periods of time. This allows him to see when a value is out of the normal range and to plan and initiate appropriate maintenance actions. The production manager, on the other hand, will primarily need overview data – order situation, production efficiency, number of components and orders processed, and so on. The example shows how different views must be derived and visualized from a single data pool and the information it contains. This is the task and purpose of dashboards.
Creating dashboards is possible without prior knowledge
This means that in order to be able to deal with the digital data really efficiently, different dashboards are necessary, which also have to be adapted to individual preferences and requirements. To avoid having to have these programmed by a service provider in every case, IoT solutions usually come with a low-code/no-code environment. These can be used, for example, to create apps in which specific values are displayed. This requires little or no programming knowledge, as no " real" programming is involved. The environments provide a construction kit in which, for example, certain displays and visualizations are available. The creator arranges these on the screen as required and then links them to the desired data – and the individual dashboard is ready.
Combining data correctly for new insights
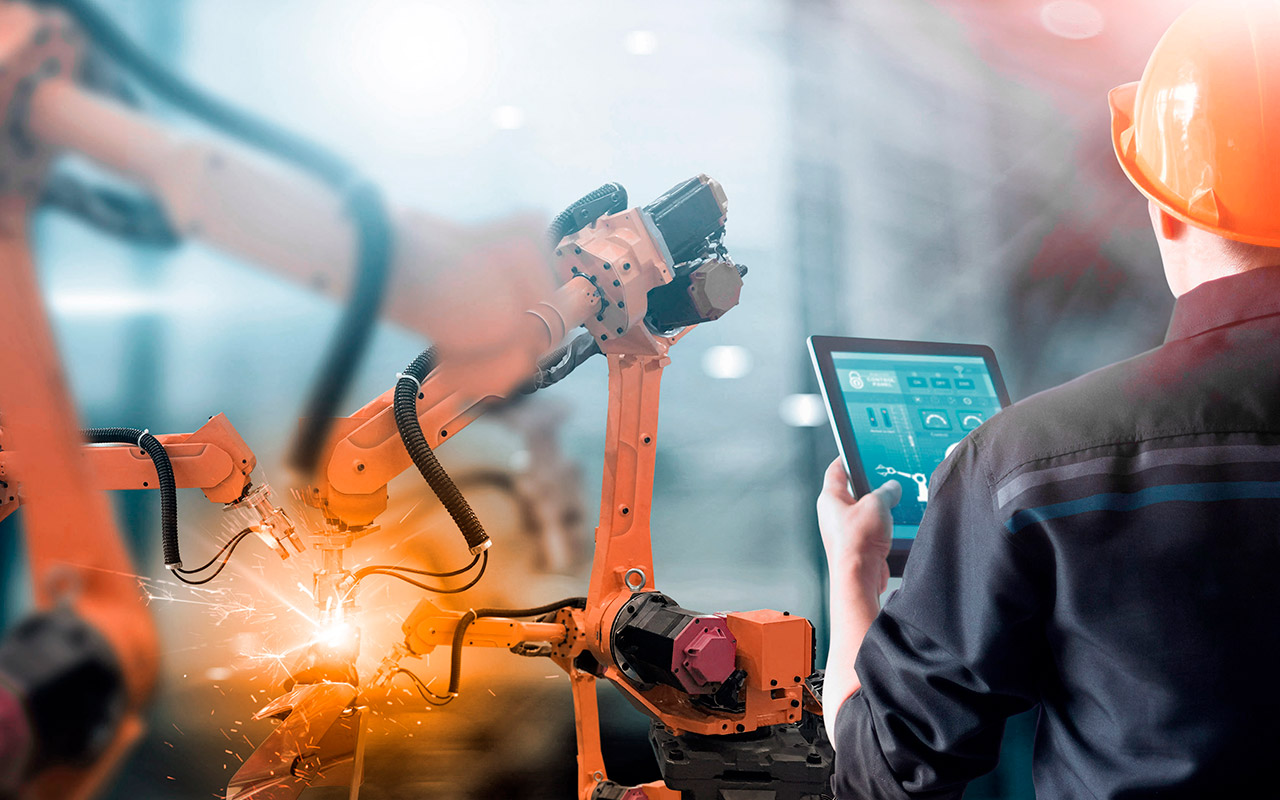
Data usually does not stand alone but gets its meaning in combination with other data. The fact that a machine gets warmer in the summer often has nothing to do with a higher cycle rate, but with the generally higher hall temperature. The evaluation of these temperatures therefore only really makes sense in combination. The progression over time is also important information. A bearing temperature of 80 degrees is not in itself an alarm signal – but if this bearing has been running much cooler for months and is now continuously getting warmer, this indicates incipient bearing damage. Similarly, sequences can offer new insights: If an order is always stalled between the same two machines, it certainly makes sense to analyze the transport situation: Is there enough space and transport capacity available, are there other reasons for the delay? Or is one of the machines the bottleneck slowing down the production flow?
Digitalization brings transparency – In the right presentation
Dashboards are the peephole into the company data, in real time they show how the company is doing – in all its facets and components. Thanks to individualized presentations, which are tailored precisely to the needs of a user with special modules, the data is presented in a concise and easily comprehensible manner.